Universidad de Málaga (University of Malaga, UMA) is a center for higher education covering 4 campuses, 19 faculties, 65 undergraduate courses and postgraduate programs, with some 3800 staff and 40,000 students, located on the Costa del Sol in southern Spain.
Many thanks to UMA Administration for permission (yet again) to publish this data.
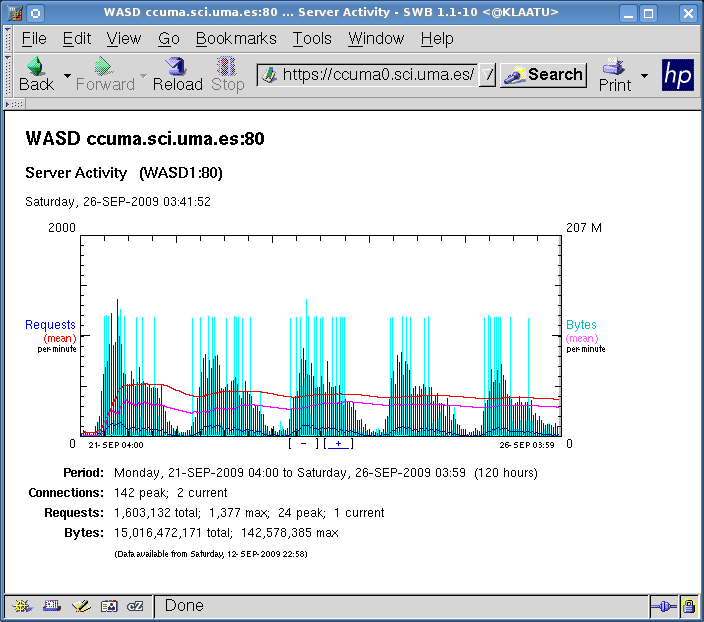
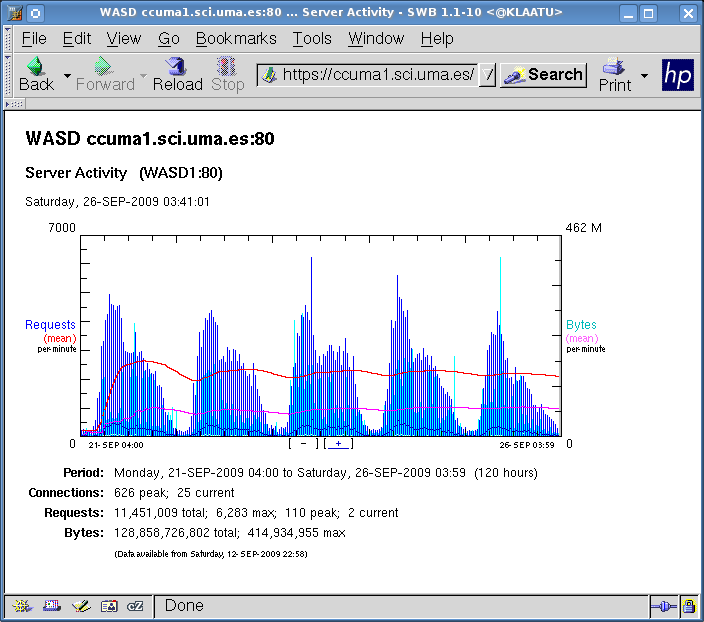
UMA is a significant user of VMS and the largest WASD site, both in terms of deployment and throughput, that the author is aware of. Since first migrating to WASD in 2003 use of Web services has outgrown its original single ES40 with 4 CPUs and 4GB, to currently being hosted across a cluster of four systems; an ES45 with 3 CPUs and 16GB, ES40 with 4 CPUs and 20GB, ES40 with 4 CPUs and 4GB, along with a DS20E 666 MH 2 CPU 1024MB. All four run under OpenVMS 8.3 and TCP/IP Services 5.6 from a single WASD installation. An imminent move to Itanium blades will ensure future growth potential. UMA's Web hosts some 160 virtual servers providing from basic, static Web content to sophisticated Web applications, including the University's resulting and registration systems.
During a five weekday
University registration period in late September 2009, UMA WASD
registered some three quarters of a
terabyte in network traffic - in fact 809,359,927,878 bytes (totalled across the three systems at snapshot). The 809GB network traffic were responses from
some 18.1 million requests. Continue reading past the "five day"
images because there's more of interest with CCUMA2
system!
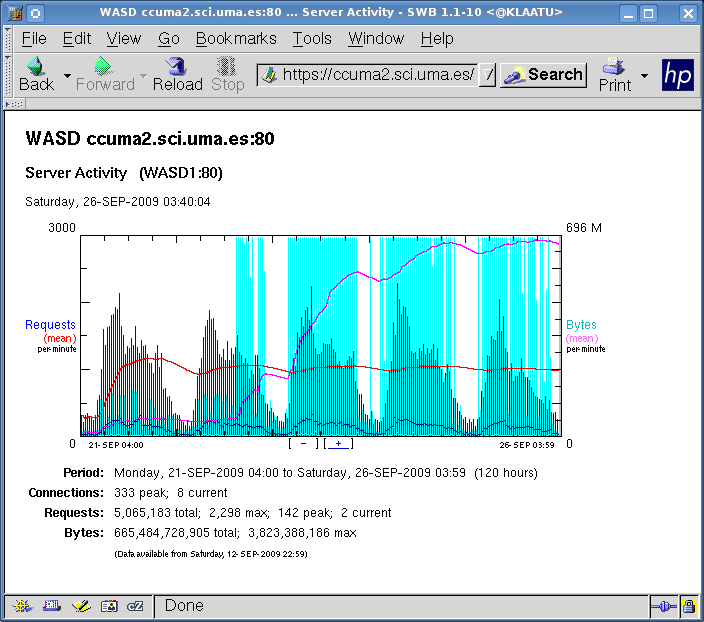
The associated, and perhaps more
interesting aspect to this registration period, is day three on the
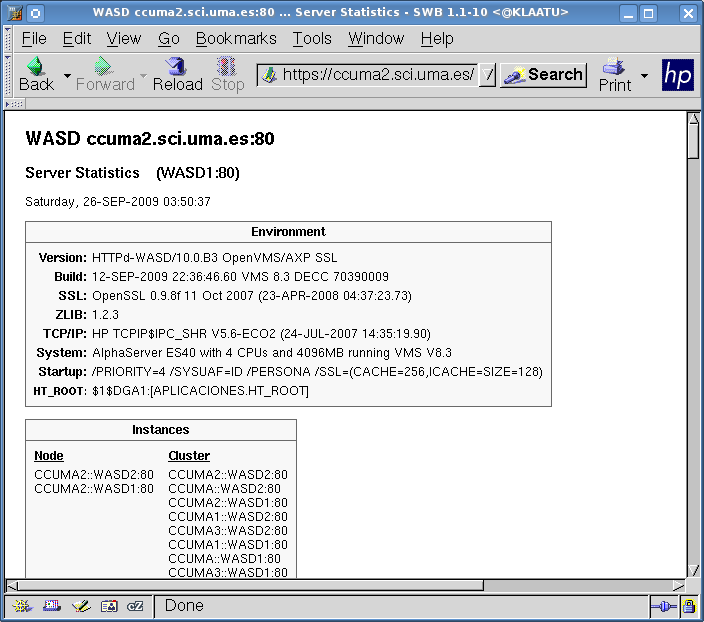
lesser of the UMA systems. This UMA VMS system, CCUMA2, a
relatively humble ES40 with 4GB memory, runs OpenVMS V8.3 and the
latest TCP/IP Services.
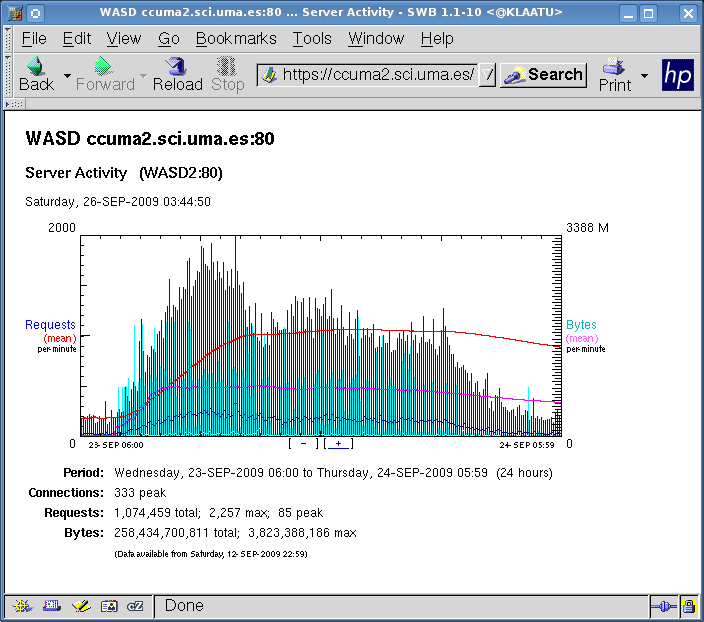
On September 23rd CCUMA2 published one quarter terabyte data in response to 1 million
requests. The peak per-minute data
to-the-wire was approximately 640Mbps. Not bad for a commodity VMS
box! See additional explanation
below. (Also note that it is running WASD v10 BETA.)
Not only that but the site was unaware of
the 258GB traffic volume the system
handled that one day (in fact the
majority during a fifteen hour period). When queried by the author of
this note, the system manager responded (over three emails):
(emphasis mine)
Turns out some new documents had been published by one of the
departments. Again, not bad for a somewhat-dated, commodity VMS
system.
After initial publication on the info-WASD mailing list, there was a response requesting further explanation on how this 640Mbps figure was obtained. The following four sections provide the (edited) email responses.
First ...
>"The peak per-minute data to-the-wire was approximately 640Mbps." > >Now, "Mbps" is "Mega bits per second", right ? > >Now, was it 640 Mb totaly sent during one *minute* ? Or what ? The last graphic shows CCUMA2's Activity Report. http://wasd.vsm.com.au/ht_root/other/CCUMA2_090929_025TB.png The statistics at the bottom of that graph give some peaks and maxima calculated for the period displayed, in this case 24 hours. Data for the Activity Report are accumulated on a PER-MINUTE granularity and so maxima and peaks represent what has happened anytime inside a given minute. For the period 06:00 23-SEP-2009 to 05:59 24-SEP-2009 there were 1,074,549 requests processed with a per-minute maximum of 2,257 (at the peak in the dark-blue bar graph), and with a per-minute peak of 85 requests in-progress (the 'peak' in the white line-graph barely discernible near the bottom axis - the 'zoom' buttons allow the graph to be enlarged providing greater detail if required). For the 24 hour period there were 258,434,700,811 data bytes (258GB) transfered on the network (some received with the request, the overwhelming majority transmitted with the response). Also during that period there were 60 seconds where the total network transfer was 3,823,388,186 bytes (3.8GB), the maximum recorded at a minute granularity during the period. 3,823,388,186 / 60 := 63,723,136 bytes per second (averaged) 64MB per second * 10 := 640M bits per second (on the wire - roughly) It can be debated what multiplier to use for extrapolation from data byte to raw bit rate (on-the-wire) but we know it is an absolute minimum of eight :-) which would make it 510Mbps. I prefer 640Mbps - it's bigger ;-) Because this is at a minute granularity it must also have been a relatively sustained rate for that minute. Either number is impressive. When you take the 24 hour total of 258,434,700,811 and divide it up that's 10.8GBytes/hour, 179MBytes/minute and 3.0Mbytes/second *average* over the whole day. This system has two DEGXA gigabit Ethernet interfaces. Both are registering traffic (though there is some asymmetry). CCUMA2$ show dev ew0/full Device EWA0:, device type DEGXA, is online, network device, error logging is enabled, device is a template only. 8< snip 8< Operating characteristics: Link up, Full duplex, Autonegotiation. Speed (Mbits/sec) 1000 8< snip 8< LANCP> show device/count 8< snip 8< CCUMA2 Device Counters EWA0 (27-SEP-2009 20:27:17.94): Value Counter ----- ------- 25759261 Seconds since last zeroed 2703934080915 Bytes received 6034698665463 Bytes sent 10921869377 Packets received 13756736389 Packets sent 8< snip 8< CCUMA2 Device Counters EWB0 (27-SEP-2009 20:27:17.95): Value Counter ----- ------- 25759261 Seconds since last zeroed 2297178408489 Bytes received 2786203942491 Bytes sent 9033690463 Packets received 11054558248 Packets sent 8< snip 8< Perhaps we should ask Uni Malaga about the configuration ... Regards, Mark. PS. Uni Malaga log analysis could probably confirm the absolute and hourly numbers for that day (though perhaps not down to minute granularity?) PPS. There is often an upshot. The Activity Report has been in WASD since 1997 and happily accumulating per-minute totals in longwords. If a relatively dated system like this can push this perilously close to overflow it must be time to revisit the code. (In fact we don't *know* that 3,823,388,186 *was* the maximum because anything larger than 4,294,967,295 when overflowed would almost certainly look smaller; and of course there is the absolute bandwidth limit of 2(1?) x DEGXA).
Second ...
>It was not the numbers as such I asked about, it >was the units used "peak per-minute" and "Mbps". >Was it a peak of 640 Mbps ? And what in that case >has the "minutes" to do with that ? >Shouldn't it realy be "peak per-second" ? Activity Report statistics are accumulated per-minute. The reported 3,823,388,186 bytes is the accumulation of all requests' network data during a specific one minute period (coinciding with a peak in the actual graph). So, it's the one minute total of all data transfered by all requests concluding during that sixty second period. If we divide that by sixty seconds to obtain the per-second data rate it comes to 63,723,136. Then multiply by your raw bit-rate factor of choice, mine being ten, and the result is 637,231,360 bits per second. >Never mind, I *do* understand that UMA is a >large WASD site, which probably is the important >thing here... :-) And that gigabit Ethernet interfaces, VMS V8.3, TCP/IP Services 5.6 and $QIOs are still pretty effective at hitting the wire!
Third ...
8< snip 8< >Activity Report statistics are accumulated per-minute. The reported >3,823,388,186 bytes is the accumulation of all requests' network data during >a specific one minute period (coinciding with a peak in the actual graph). >So, it's the one minute total of all data transfered by all requests >concluding during that sixty second period. If we divide that by sixty ^^^^^^^^^^^^^^^^^^^^^^^^^^^^^^^^^^^^^^^^^^^ >seconds to obtain the per-second data rate it comes to 63,723,136. Then >multiply by your raw bit-rate factor of choice, mine being ten, and the >result is 637,231,360 bits per second. 8< snip 8< The underscored section concerned me a little upon reflection. Server statistics are updated at the conclusion of a request. Not unreasonable considering many are not finalised until then (e.g. duration, total data transfer) and that you don't want to be mutexing the shared statistics global section more often than necessary, particularly on a busy server. For requests that begin and end within a given minute it's of no consequence when the per-minute statistics are accumulated. For requests that begin in one minute and end in the next it's hardly noteworthy either. However, for requests that begin in one and then end tens later, particularly if they transfer significant quantities of data, it could tend to skew the stats for that concluding minute. Consider this scenario ... A quiet server begins a response of ten megabytes to a slow client. The transfer takes ten minutes. That's 1MB per minute data rate, approximately 17kB per second, or 170kbps raw bit rate (using my factor of ten). However the Activity Report records that data for the minute the request *concludes* and calculates the volumes and rates based on that minute. It *looks* like there was a large spike in traffic at that minute rather than a more moderate level over the preceding ten. It *looks* like that minute contained a 10MB response that may have been transferred at a rate of 170kBps and 1.7Mbps (that is 10MB over a maximum of 59 seconds). A factor of ten difference to the actual data rate. Having considered this, it is still an outlying example. Most requests on most servers begin and conclude within the second or seconds. The skew is negligible unless you have an atypical service or atypical request where responses contain lots of data and take many tens, perhaps many hundreds, of seconds to conclude. Of course it appears this is what has recently occurred at Uni Malaga. You can see when the publications in question became available; when the cyan bars appear prominently on the graph, mid-afternoon on day 2, the 22nd Sept. http://wasd.vsm.com.au/ht_root/other/CCUMA2_090926.png This has introduced some traffic where a small number of single requests are transferring tens of megabytes of PDF over many minutes. Here is such an item from the Request Report shortly before it concluded. |004 http://webdeptos.uma.es:80 29-SEP-2009 17:00:45 483 108,907,016 100 42,832 00:42:22 [P][+][W] 42150 | nnn.nnn.nnn.nnn GET /BiolVeg/FLORANDORR4.pdf 110MB of PDF document transferred over 43 minutes. Surely this will skew the per-minute statistics when it concluded? Yes. It becomes a question of by how much. If on a quiet server with little else in that minute then it will be a significant, perhaps overwhelming, factor. The busier the minute the less the effect. In a minute where there was 1GB of other traffic there is an approximate 11% skew, in 10GB some 1.1%. For CCUMA2 in this case? In the minute under discussion where 3,823,388,186 bytes were reported, such a (hypothetical) transfer of 110MB in 3.8GB would be about 3%. So you'd need something like one of these forty minute transfers concluding every six seconds during that minute to skew the per-minute data volume by some 30%. Possible but unlikely. Other indications that the suggested raw bit rate of 640Mbps is not in the realm of fantasy? Well, as previously noted, the overall data rate was some 30Mbps for the 24 hours. When you take the 24 hour total of 258,434,700,811 and divide it up that's 10.8GBytes/hour, 179MBytes/minute and 3.0Mbytes/second *average* over the whole day. With an averaged 30Mbps (mega bits per second) it's quite conceivable that peaks might be a factor of ten on that, or 300Mbps. We're already halfway there. A peak with an amplitude of 20 times *average* brings us to 600Mbps. Of course someone may yet comment that the reported configuration of 2 x DEGXA, VMS V8.3 and TCP/IP Service 5.6 couldn't possibly support such data rates! Or can!! Or that the access logs corroborate this report (of course they suffer the same constraint as the Activity Report - associating the transfered quantity with a specific time-stamp not with a period). Sigh. Conclusions ... With atypical requests the per-minute statistics can be skewed. By how much depends on the overall level of activity. Temper your conclusions from them.
Fourth ...
>Interesting -- and again emphasises the worth of looking at trends rather >than instances in time. No argument. Though it irked me enough to investigate periodic updates to long-running requests. Turned out to be minimal code and because the functionality is only performed every fifteen seconds or so (using one of the supervisory lists maintained by WASD) it has minimal overhead. So the next release should update the per-minute network traffic accumulators a minimum of three times a minute. Gives a more accurate assessment of data rates.
Mark Daniel
26-SEP-2009
Revised: 01-OCT-2009