Can WASD Adapt to The
Load?
Universidad
de Málaga (University of Malaga, UMA) is a center for higher education
covering 4 campuses, 19 faculties, 65 undergraduate courses and postgraduate
programs, with some 3800 staff and 40,000 students, located on the Costa del
Sol in southern Spain. Many thanks to UMA Administration (again) for
permission to publish this data.
The UMA
front-end
system is an ES40 with four EV68A, 833MHz CPUs, 4GB memory, running
OpenVMS 7.3-2 and TCP/IP Services 5.4.
Although a user of WASD
since 2003 (and other Web technologies on VMS previously), 2006 was the first
time a fully Web-based student registration system had been implemented -
see Can WASD Handle The Load?
At the commencement of the 2007-2008 academic year student registration
and associated staff activities again were to be performed using the
platform. It included WASD v9.2.1, PHP Version 4.3.10 (via the
CSWS PHP v1.3 engine) along with a number of in-house front- and back-end
applications distributed across other VMS and Linux-based systems.
UMA staff had further developed and thoroughly tested the registration
application suite for functionality and behaviour under load. Any
observed issues had been analysed and addressed. Result; high levels of
confidence!
Pre-Registration Week
Registration for
a subset of the student body during the week before general
registration performed as expected - uneventfully.
Week One
Day one of general registration
began to experience Web service and system performance issues.
Delays and timeouts during request processing. Processes
swapped-out. Lots of page faulting. System 'clogged'.
Cursory analysis using MONITOR SYSTEM shows CPU fully
utilised, limited free list and high page faulting.
This is reflected in the Web service activity report for day one.
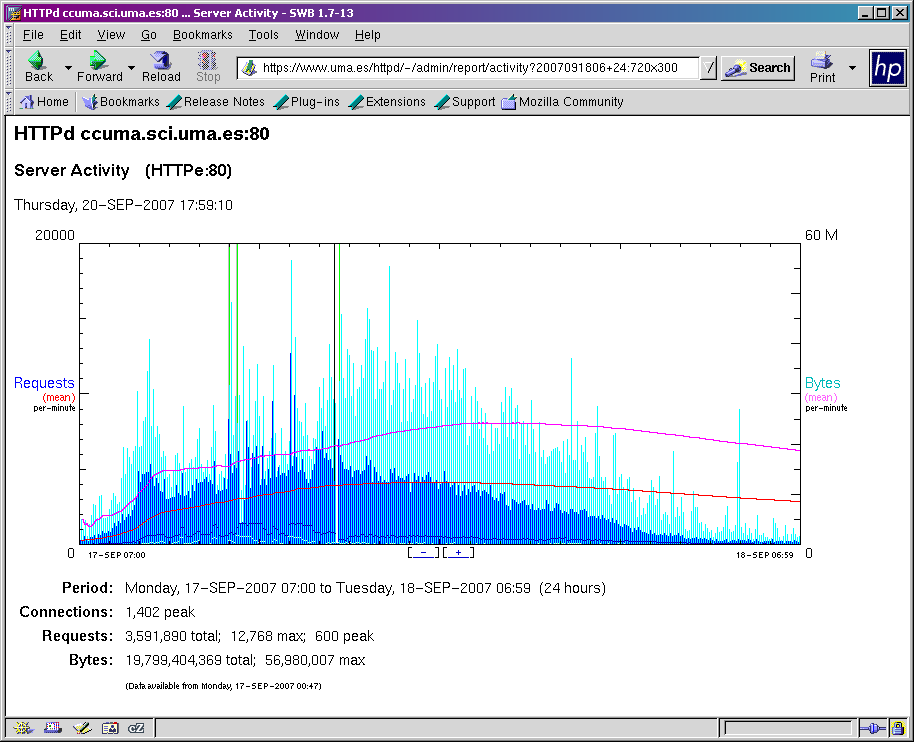
The dark blue line towards the bottom of the above graph (peak network
connections per second) and the white line below it (peak
requests-in-progress
per second) show significant variability and enormous peaks and
plateaus as
system processing repeatedly grinds to a halt. The peaks of 1,402
connections and 600 requests-in-progress represent server configuration
limits at which HTTP 503 status is immediately returned. The
server was restarted
during problem investigation.
Analysis during the initial period of that first day using WASD
Statistics and WATCH, Availability Manager, T4, and the netstat
utilitiy,
revealed a Web-based application suite, unrelated to registration
processing
per se but of particular interest to students beginning the new year,
was significantly resource-intensive (memory and CPU). Under more
everyday usage this was not an
issue but the large number of instances of this application combined
with the load presented by the registration suite itself
resulted in resource starvation of all processing on the system.
With the primary contributing factor identified and understood a
solution could be explored. Unable immediately to increase
physical memory or CPU capacity the obvious solution for controlling
the situation was to reduce the number of instances of the identified
application. This would prevent the resource starvation, in
particular virtual memory demands and the associated page faulting,
allowing the more important registration applications to conclude
successfully in a timely manner. This readily could be
accomplished using the WASD throttle (request queuing) facility.
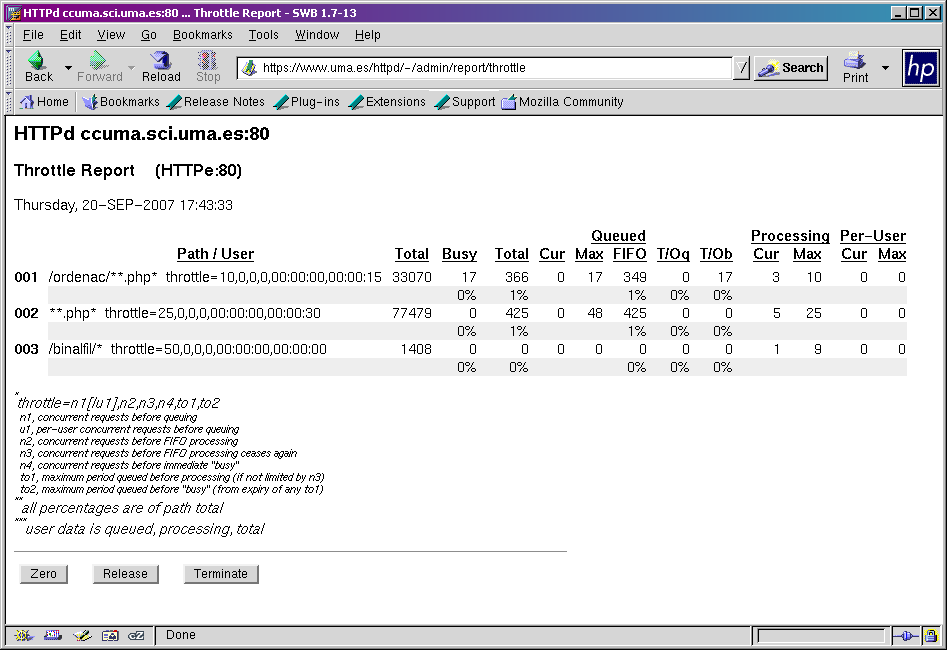
Already
in
general use to limit concurrent PHP applications to numbers supported
by available CPU resources (rule **.php*) it
was a matter of introducing an additional throttle
rule specifically against the problematic application to severely limit
its numbers (rule /ordenac/**.php*).
A configuration file edit and a rule reload introduced the new
control.
Very soon the efficacy of the new rule was obvious. Request
processing improved in latency, request timeouts dropped and system
paging reduced dramatically.
A solution without a system redesign
or even a required Web server restart!
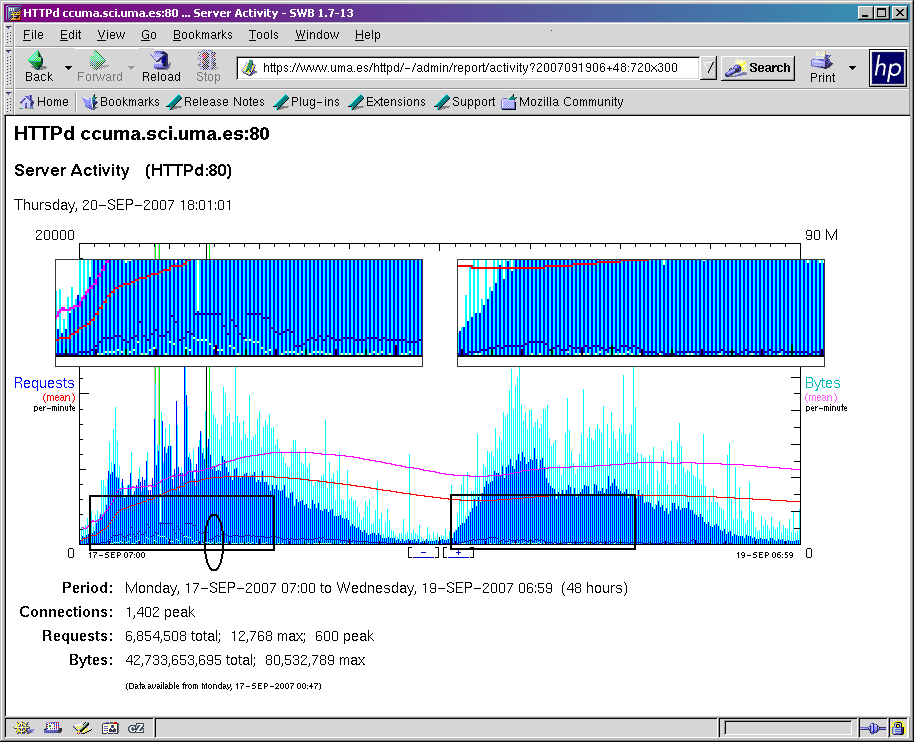
Day two conclusively demonstrated
the
additional throttle rule to be an effective solution. The
enlarged sections in this graphic displaying days one and
two show comparable periods during peak processing. Note the
much greater stability in peak connections and
requests-in-progress on day two.
Similar stability can be seen beginning in the day one graph following
the introduction of the trial rule (circled). Day two throughput
was
also approximately 20% greater, understandable considering the much
less
inefficient use of system resources. Compared to
day one there were effectively zero processing issues. Further
observation allowed the new and very severe throttle rule to be
relaxed somewhat, increasing the numbers of the problematic application
until an effective ratio of that and the registration application suite
produced a fully utilised but not over-extended system. Again,
changes without needing to interrupt registration processing with
server restarts or the like.
The
longer term solution will be a now-programmed quadrupling of
physical memory to 16GB, addressing the most significant problematic
system behaviour identified during this period, the excessive page
faulting.
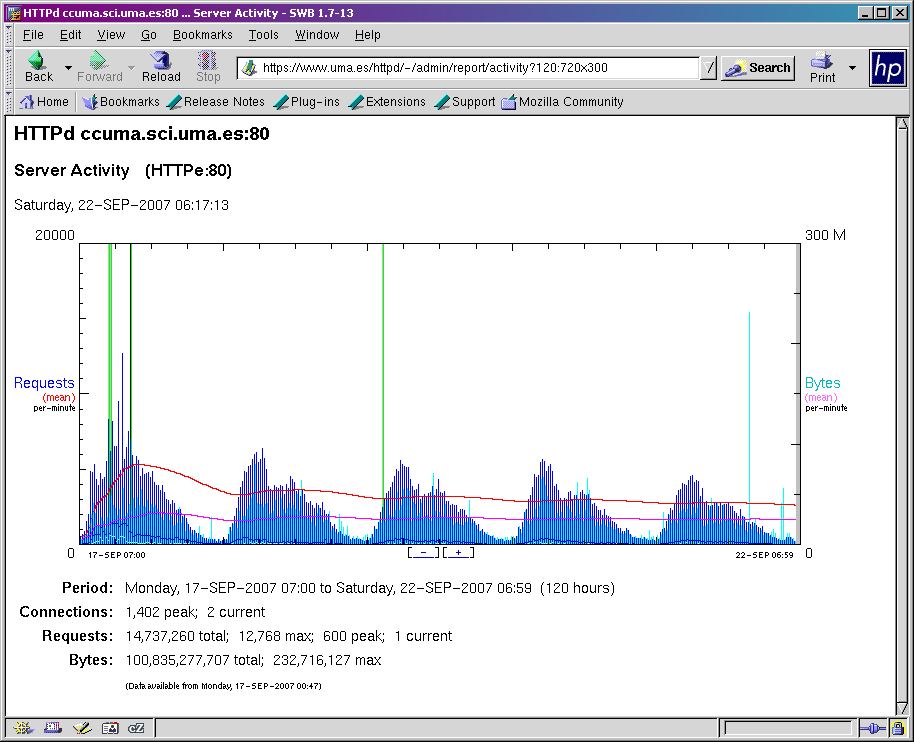
The full five days of
the first week of general registration shows some 14.7 million
requests
processed and 101GB transfered. Some 26GB of this included
gzip-compressed HTTP/1.1 responses to 60GB of original content
(compression to 46%) indicating
a total 133GB of request data actually processed. The extreme
peak requests-in-progress and network connections during day one
distort the Y-axis of this particular graphic.
Week Two
The second week of general registration proceded without significant
issue.
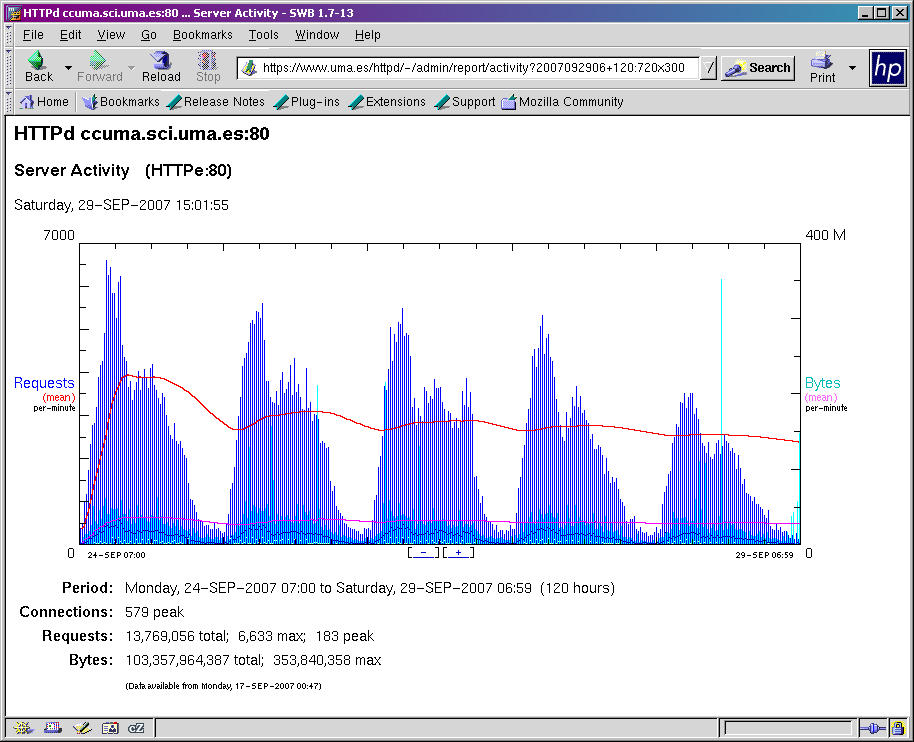
The five
weekdays of this second week show some 13.8 million requests
processed and 103GB transferred. The Y-axis scaling of this
graphic is entirely different to week 1, showing greater detail and
dynamic range. The peak number of concurrent connections was 579
and peak concurrent requests-in-progress 183, with the maximum
processed in any one minute 6,633 or a little more than 110 per second.
In total the ten weekdays of
registration processed some 28.5 million requests and
transferred 204GB of network traffic. Approximately 50GB of this
represented 117GB of gzip-compressed HTTP/1.1 response (compression to
46%) indicating a total of 271GB response data handled over the ten
days.
The period described in this document is slightly different to that of
2006 - Can
WASD Handle The Load? For a comparable fourteen days,
spanning two weekends and beginning the first Monday of general
registration, a total of 33.7 million requests and 267GB were processed,
slightly up on 2006. Statistics related to gzip-compression were
not noted in 2006.
Congratulations
... to University of Malaga
IT staff after yet another very successful year of
Web-based registration
and for being
able to
troubleshoot effectively under significant pressure!
Conclusion
Can WASD adapt to your load? Almost certainly!
Mark Daniel
04-OCT-2007